

Renter migration is underway. In a survey conducted by Rent. in November 2021, 60 percent of renters reported that they planned to move in the next six months. Pandemic-related pressures also influenced 25 percent of moves over the last 18 months, according to the 2022 Renter Preferences Survey Report from the National Multifamily Housing Council (NMHC) and Grace Hill.
To learn where Americans are moving, Rent. researchers mined the site’s user data to gauge interest in listings by geographic location. They aggregated these numbers to discover which states and metros were more and less popular with renters.
How the migration report works
This analysis focused on the second quarter of 2022 and includes data from April, May and June. It combined these numbers into a single measure called the “lead delta,” which shows the difference between the number of inbound and outbound leads within a particular geographic area. A “lead” is a rental industry term for a prospective resident who submits information to a property owner or management group indicating interest in an apartment, condo or rental home.
Geographies with more inbound than outbound searches have a positive lead delta. This indicates that the metro or state is growing in popularity. A negative lead delta means that there is more outbound than inbound searches in a particular state or metro, indicating a decrease in popularity.

Regional trends
Metros and states in the Northeast and West saw more outbound leads during the second quarter. States and cities in the Midwest and the South saw more inbound leads during the same time period. There’s evidence that this desire to move to the center and southern parts of the country is at least partially driven by economic factors.
The two most expensive cities for renters in the U.S. are both located in the Northeast. So are 13 percent of the Top 100 most expensive cities for renters. The majority of the most expensive markets for renters (58 percent) are in the West. Of these, 41 percent are in California.
In contrast, Chicago is the only Midwestern city on the most expensive list. And several cities in the Midwest and South showed the biggest rent savings between June 2021 and June 2022. That makes a difference to renters’ budgets since rents rose by double digits across the country during the same time period.
| Region | Leads Out | Leads In | Difference | Lead Delta |
|---|---|---|---|---|
| Midwest | 1,041,516 | 1,084,364 | 42,848 | 2.01% |
| Northeast | 972,446 | 853,716 | -118,730 | -6.50% |
| South | 1,821,890 | 1,930,385 | 108,495 | 2.89% |
| West | 841,487 | 813,688 | -27,799 | -1.68% |
The Northeast saw a -6.5 percent lead delta this quarter. The region also saw the lowest lead delta ( -1.67 percent) in the First Quarter 2022 Rent. Migration Report.
The West had a negative lead delta during the second quarter. At -1.7 percent, it’s lower than the Northeastern region this quartet, but a gain on the region’s -0.20 percent showing during the first quarter of 2022.
The Midwest and the South both showed positive migration interest during the same period. Inquiries into Midwestern properties were up by a lead delta of 2 percent, higher than the Midwest’s first quarter 1.3 percent lead delta. The South logged a 2.9 percent lead delta in this survey period, up from 0.23 percent in the previous quarter.
State-level trends
Renters interest in the Midwest and South is highlighted by state-level trends. Three of the states with the highest inbound lead delta were in the South, joining North Dakota and New Hampshire in the top five.
States with the highest inbound lead delta
The state with the highest lead delta (30.38 percent) is Delaware, considered a Southern state by the U.S. Census. The only Midwestern state in the top 5 is North Dakota. It comes in at No. 2 with a lead delta of 29.53 percent. South Carolina follows with a lead delta of 28.99 percent. New Hampshire (26.32 percent) and Mississippi (25.16 percent) round out the Top 5 states with the highest inbound lead delta.
Delaware, North Dakota and New Hampshire were also among the Top 5 states last quarter. (North Dakota took the third slot, followed by South Carolina and Delaware.) This six-month trend indicates consistent renter interest in these states.
| State | Leads Out | Leads In | Difference | Lead Delta |
|---|---|---|---|---|
| Delaware | 12,961 | 24,272 | 11,311 | 30.38% |
| North Dakota | 15,724 | 28,900 | 13,176 | 29.53% |
| South Carolina | 52,028 | 94,504 | 42,476 | 28.99% |
| New Hampshire | 15,623 | 26,785 | 11,162 | 26.32% |
| Mississippi | 28,812 | 48,181 | 19,369 | 25.16% |
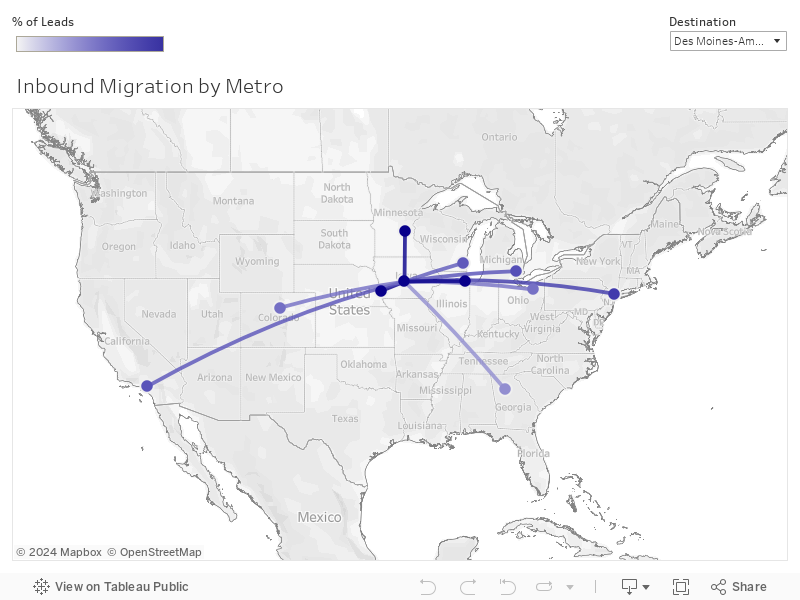
The largest group of people interested in moving to a state typically comes from within the state itself. (That’s true of all cities and states profiled here.) In most other cases, key migration regions include nearby and adjacent states.
For example, most of the people interested in moving to Delaware came from neighboring locales. Of these, 30.97 percent already lived in Delaware. Other states include Northeastern locations such as Pennsylvania (29.68 percent), New York (8.8 percent) and New Jersey (4.73 percent). And Southern origins from Maryland (5.94 percent) and Washington, D.C., (4.02 percent).
South Carolina attracted interest from in-state renters, as well as residents of other Southern states, including neighbors North Carolina and Georgia, as well as Florida and Texas. Combined, they add up to 78.09 percent of all inbound leads. One Northeastern state, New York, accounted for another 6.72 percent.
Just over 80 percent of renters considering migration to New Hampshire are from Northeastern states, including New Hampshire itself, Massachusetts, New York and Maine. Florida and Maryland supply 2.56 percent and 2.14 percent of the inbound leads, respectively.
Likewise, the majority (65.55 percent) of renters thinking about moving to Mississippi are from the South. They hail from Mississippi, Georgia, Texas and the state’s neighbors Alabama and Louisiana. Another 6.69 percent of Mississippi’s leads came from renters in Illinois.
Bucking the regional trend is North Dakota. While most interest comes from renters within North Dakota (32.62 percent) and its neighbor, Minnesota (21.24 percent), the state also draws a combined 20.23 percent of its migration interest from Illinois, California, New York and Texas. Major population centers that are far from its borders.
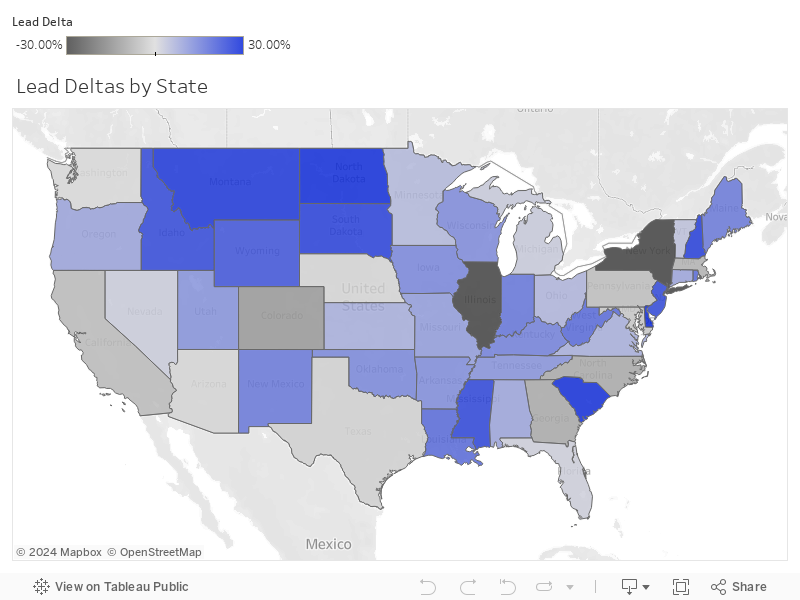
States with the highest outbound delta
States that saw more outbound than inbound migration leads show greater geographic diversity. This category includes states in the Northeast, Midwest, West and South.
More renters wanted to leave New York (-35.34 percent), followed closely by Illinois (-31.69 percent). Renters in Colorado (-12.7 percent), Georgia (-9.6 percent) and North Carolina (-9.48 percent) also showed interest in outbound migration.
Three of these states also had the greatest number of outbound leads in early 2022. They include New York, Colorado and Illinois, in that order.
Migration trends within states with higher outbound leads
Most New York renters wanted to stay in New York (35.34 percent) and nearby New Jersey (17.46 percent). Other states, including Florida in the South, Pennsylvania and Connecticut in the Northeast and Ohio in the Midwest, received between 3.2 and 5.35 percent of leads each.
Illinois renters wanted to stick a little closer to home. Most inquired about apartments in Illinois (35.27 percent) and neighbors Indiana (11.96 percent), Missouri (3.98 percent) and Wisconsin (4.86 percent). But they also researched apartments in Texas and Tennessee.
Residents of Georgia and North Carolina kept their migration inquiries firmly focused on other Southern states. Over half of renters in both states (55.25 percent in Georgia and 52.36 percent in North Carolina) were eyeing an in-state move. All of the other top lead recipients were from Southern states.
In contrast, Colorado renters either wanted to stay in-state or leave the West entirely. While 49 percent of Colorado renters inquired about available apartments in their home state, they also researched homes in Missouri, Oklahoma, Wisconsin, Texas and Kansas. Together, these states account for 15.35 percent of Colorado’s outbound leads.
| State | Leads Out | Leads In | Difference | Lead Delta |
|---|---|---|---|---|
| New York | 405,200 | 196,189 | -209,011 | -34.75% |
| Illinois | 253,980 | 131,736 | -122,244 | -31.69% |
| Colorado | 74,360 | 57,596 | -16,764 | -12.70% |
| Georgia | 246,907 | 203,651 | -43,256 | -9.60% |
| North Carolina | 190,014 | 157,100 | -32,914 | -9.48% |
Metro-level trends
The South continues to dominate the list of inbound destinations.
Metros with the highest inbound delta:
For the second quarter, four of the top-five destinations are in the South. Only Springfield, MO, is outside of the region. Find the rest in Alabama, Virginia, Mississippi and Tennessee.
The top migration destination is the Huntsville–Decatur (Florence) metropolitan area in northern Alabama. It has a lead delta of 41.77 percent and draws 29.19 percent of its leads from within the metro and another 14.64 percent from nearby Birmingham. But renters from Chicago, Nashville and Charlotte are also interested in relocating there.
| Metro | Leads Out | Leads In | Difference | Lead Delta |
|---|---|---|---|---|
| Huntsville-Decatur (Florence), AL | 8,794 | 21,408 | 12,614 | 41.77% |
| Tri-Cities, TN-VA | 9,901 | 23,263 | 13,362 | 40.29% |
| Biloxi-Gulfport, MS | 9,458 | 22,076 | 12,618 | 40.01% |
| Knoxville, TN | 15,615 | 34,278 | 18,663 | 37.41% |
| Springfield, MO | 12,765 | 27,748 | 14,983 | 36.98% |
The Tri-Cities metropolitan area takes the No. 2 slot with a 40.29 percent lead delta. It includes Kingsport, Johnson City, Bristol and the surrounding communities on either side of the Tennessee-Virginia border. Leads came from as far away as New York (5 percent), but most inquiries were from within the metro and Nashville (15.75 percent). The Southern cities of Atlanta, Knoxville and Charlotte also contributed about 4 percent each.
Biloxi-Gulfport, MS, reprised its role in the top 5 again this quarter, coming in at No. 3 with a lead delta of 40.01. (That’s up from 36.40 percent from last quarter.) Most people (56.45 percent) who wanted to move here hailed from southern communities, including New Orleans, Atlanta, Mobile, Pensacola and Jackson. Another 6.21 percent lived in Chicago, the most expensive city for renters in the Midwest.
Knoxville, TN, logged a lead delta of 37.40 percent. It pulls 17.82 percent of its leads from Nashville. The city also attracted interest from major metropolitan areas, including Atlanta, New York, Chicago and Charlotte.
Springfield, MO, with a lead delta of 36.98 percent, also attracted significant interest from larger urban areas. They include the Midwestern cities of Chicago (9.18 percent), St. Louis (8.87 percent) and Kansas City, MO (4.7 percent), and Denver and Los Angeles in the West.
Metros with the highest outbound delta
Metros with the lowest lead delta numbers include Charlotte (-32.90 percent), St. Louis (-32.47 percent), Chicago (-32.04 percent) and Atlanta (-29.62 percent). They frequently appeared as sources of leads for the top inbound cities.
Austin also made the list at No. 4 with a lead delta of -23.15 percent. Renters in this Texas city also saw the average cost of a one-bedroom increase by 108.2 percent since last June. That’s the largest increase in the nation.
| Metro | Leads Out | Leads In | Difference | Lead Delta |
|---|---|---|---|---|
| Charlotte, NC | 94,994 | 47,966 | -47,028 | -32.90% |
| St. Louis, MO | 32,809 | 16,727 | -16,082 | -32.47% |
| Chicago, IL | 244,371 | 125,754 | -118,617 | -32.05% |
| Austin, TX | 49,226 | 26,729 | -22,497 | -29.62% |
| Atlanta, GA | 182,158 | 113,677 | -68,481 | -23.15% |
Migration trends for metros with high outbound numbers
Renters in Charlotte didn’t want to move far. The most popular communities they searched for were in North and South Carolina.
St. Louis residents wanted to stay close to home too. They searched for homes in their own city, as well the Missouri communities of Springfield, Columbia–Jefferson City and Cape Girardeau (which shares a metro with Paducah in Kentucky, Harrisburg and Mount Vernon in Illinois). Indianapolis and Dallas–Ft. Worth also received 2.15 percent and 1.65 percent of the city’s leads.
Renters in Chicago liked Midwestern cities like Indianapolis, Milwaukee and Minneapolis–St. Paul, Dallas-Ft. Worth and Nashville also attracted their attention.
Austin renters focused on in-state migration. Their top six searches were all in Texas, including San Antonio, the Waco–Temple–Bryan metro, Houston, Corpus Christi and Dallas-Fort Worth.
Just over half (53.64 percent) of Atlanta renters wanted to stay in the South. They inquired about communities in Georgia, as well as Birmingham, AL.

The takeaway
Renters are moving away from major metropolitan areas in the West and Northeast for the second quarter in a row. More affordable rents and a lower cost of living mean continued interest for communities in the South and Midwest.
| State | Leads Out | Leads In | Difference | Lead Delta |
|---|---|---|---|---|
| Delaware | 12,961 | 24,272 | 11,311 | 30.38% |
| North Dakota | 15,724 | 28,900 | 13,176 | 29.53% |
| South Carolina | 52,028 | 94,504 | 42,476 | 28.99% |
| New Hampshire | 15,623 | 26,785 | 11,162 | 26.32% |
| Mississippi | 28,812 | 48,181 | 19,369 | 25.16% |
| New Jersey | 147,300 | 243,183 | 95,883 | 24.55% |
| Louisiana | 48,742 | 71,540 | 22,798 | 18.95% |
| Indiana | 121,687 | 172,279 | 50,592 | 17.21% |
| New Mexico | 18,486 | 25,822 | 7,336 | 16.56% |
| Kentucky | 38,698 | 52,491 | 13,793 | 15.13% |
| Iowa | 23,923 | 31,902 | 7,979 | 14.29% |
| Oklahoma | 33,061 | 43,874 | 10,813 | 14.05% |
| Wisconsin | 73,091 | 95,900 | 22,809 | 13.50% |
| Arkansas | 28,440 | 37,095 | 8,655 | 13.21% |
| Utah | 33,147 | 42,432 | 9,285 | 12.29% |
| Tennessee | 129,919 | 166,152 | 36,233 | 12.24% |
| Missouri | 70,168 | 86,957 | 16,789 | 10.69% |
| Oregon | 37,680 | 45,475 | 7,795 | 9.37% |
| Alabama | 72,410 | 87,130 | 14,720 | 9.23% |
| Connecticut | 62,364 | 74,993 | 12,629 | 9.19% |
| Kansas | 24,692 | 28,761 | 4,069 | 7.61% |
| Virginia | 125,952 | 146,159 | 20,207 | 7.43% |
| Ohio | 206,776 | 235,613 | 28,837 | 6.52% |
| Minnesota | 74,395 | 83,780 | 9,385 | 5.93% |
| Michigan | 142,201 | 150,194 | 7,993 | 2.73% |
| Nevada | 39,002 | 40,966 | 1,964 | 2.46% |
| Florida | 327,912 | 341,272 | 13,360 | 2.00% |
| Washington | 85,774 | 85,389 | -385 | -0.22% |
| Arizona | 86,754 | 85,479 | -1,275 | -0.74% |
| Nebraska | 29,051 | 28,409 | -642 | -1.12% |
| Texas | 331,197 | 320,380 | -10,817 | -1.66% |
| Maryland | 110,650 | 102,780 | -7,870 | -3.69% |
| Pennsylvania | 216,986 | 193,942 | -23,044 | -5.61% |
| California | 439,515 | 390,801 | -48,714 | -5.87% |
| Massachusetts | 103,450 | 88,958 | -14,492 | -7.53% |
| North Carolina | 190,014 | 157,100 | -32,914 | -9.48% |
| Georgia | 246,907 | 203,651 | -43,256 | -9.60% |
| Colorado | 74,360 | 57,596 | -16,764 | -12.70% |
| District of Columbia | 36,166 | 22,033 | -14,133 | -24.28% |
| Illinois | 253,980 | 131,736 | -122,244 | -31.69% |
| New York | 405,200 | 196,189 | -209,011 | -34.75% |
| Metro | Leads Out | Leads In | Difference | Lead Delta |
|---|---|---|---|---|
| Huntsville-Decatur (Florence) AL | 8,794 | 21,408 | 12,614 | 41.77% |
| Tri-Cities TN-VA | 9,901 | 23,263 | 13,362 | 40.29% |
| Biloxi-Gulfport MS | 9,458 | 22,076 | 12,618 | 40.01% |
| Knoxville TN | 15,615 | 34,278 | 18,663 | 37.41% |
| Springfield MO | 12,765 | 27,748 | 14,983 | 36.98% |
| Chico-Redding CA | 5,051 | 10,916 | 5,865 | 36.73% |
| Macon GA | 10,349 | 21,950 | 11,601 | 35.92% |
| Baton Rouge LA | 7,828 | 16,394 | 8,566 | 35.36% |
| Savannah GA | 12,600 | 26,312 | 13,712 | 35.24% |
| Augusta GA | 11,247 | 23,316 | 12,069 | 34.92% |
| Waco-Temple-Bryan TX | 9,806 | 20,234 | 10,428 | 34.71% |
| Ft. Smith-Fayetteville-Springdale-Rogers AR | 7,702 | 15,712 | 8,010 | 34.21% |
| Toledo OH | 10,741 | 21,798 | 11,057 | 33.98% |
| Flint-Saginaw-Bay City MI | 6,856 | 13,691 | 6,835 | 33.27% |
| Roanoke-Lynchburg VA | 13,080 | 25,900 | 12,820 | 32.89% |
| Evansville IN | 7,267 | 13,777 | 6,510 | 30.94% |
| Reno NV | 8,508 | 16,090 | 7,582 | 30.82% |
| Columbus GA | 8,111 | 15,337 | 7,226 | 30.82% |
| Green Bay-Appleton WI | 10,006 | 18,858 | 8,852 | 30.67% |
| Greenville-Spartanburg-Asheville-Anderson | 14,494 | 27,215 | 12,721 | 30.50% |
| Dayton OH | 15,561 | 28,928 | 13,367 | 30.05% |
| Charleston SC | 11,198 | 20,657 | 9,459 | 29.69% |
| Columbia SC | 12,953 | 23,758 | 10,805 | 29.43% |
| Fargo-Valley City ND | 13,607 | 24,824 | 11,217 | 29.19% |
| Lansing MI | 5,278 | 9,617 | 4,339 | 29.13% |
| Tallahassee FL-Thomasville GA | 7,283 | 13,220 | 5,937 | 28.96% |
| Harrisburg-Lancaster-Lebanon-York PA | 22,025 | 39,937 | 17,912 | 28.91% |
| Chattanooga TN | 8,163 | 14,754 | 6,591 | 28.76% |
| Springfield-Holyoke MA | 7,383 | 13,184 | 5,801 | 28.21% |
| Wichita-Hutchinson KS | 5,539 | 9,873 | 4,334 | 28.12% |
| South Bend-Elkhart IN | 12,388 | 22,043 | 9,655 | 28.04% |
| Madison WI | 12,949 | 22,919 | 9,970 | 27.80% |
| Colorado Springs-Pueblo CO | 6,375 | 11,279 | 4,904 | 27.78% |
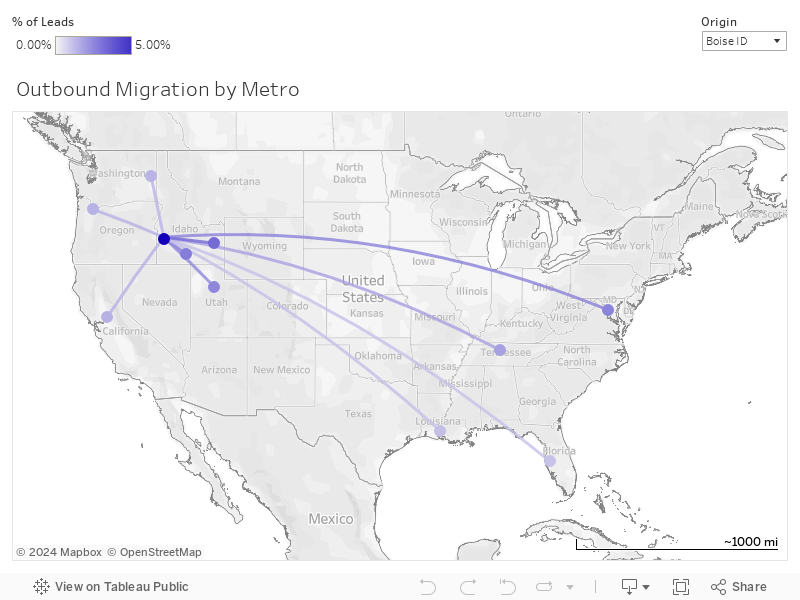
| Boise ID | 5,186 | 9,070 | 3,884 | 27.24% |
| Champaign & Springfield-Decatur IL | 5,389 | 9,353 | 3,964 | 26.89% |
| Greenville-New Bern-Washington NC | 6,294 | 10,750 | 4,456 | 26.14% |
| Tucson (Sierra Vista) AZ | 9,364 | 15,804 | 6,440 | 25.59% |
| Greensboro-High Point-Winston Salem NC | 21,592 | 36,412 | 14,820 | 25.55% |
| Fresno-Visalia CA | 15,037 | 25,266 | 10,229 | 25.38% |
| Bakersfield CA | 7,300 | 12,184 | 4,884 | 25.07% |
| Montgomery-Selma, AL | 5,868 | 9,592 | 3,724 | 24.09% |
| Spokane WA | 7,508 | 12,241 | 4,733 | 23.97% |
| Florence-Myrtle Beach SC | 8,902 | 14,294 | 5,392 | 23.25% |
| Ft. Wayne IN | 5,668 | 8,847 | 3,179 | 21.90% |
| Albany-Schenectady-Troy NY | 16,245 | 25,203 | 8,958 | 21.61% |
| Rochester NY | 14,617 | 22,402 | 7,785 | 21.03% |
| Portland-Auburn ME | 8,305 | 12,622 | 4,317 | 20.63% |
| Providence-New Bedford,MA | 12,474 | 18,630 | 6,156 | 19.79% |
| Norfolk-Portsmouth-Newport News VA | 39,040 | 58,104 | 19,064 | 19.62% |
| Grand Rapids-Kalamazoo-Battle Creek MI | 17,395 | 25,753 | 8,358 | 19.37% |
| Metro | Leads Out | Leads In | Difference | Lead Delta |
|---|---|---|---|---|
| Charlotte NC | 94,994 | 47,966 | -47,028 | -32.90% |
| St. Louis MO | 32,809 | 16,727 | -16,082 | -32.47% |
| Chicago IL | 244,371 | 125,754 | -118,617 | -32.05% |
| Austin TX | 49,226 | 26,729 | -22,497 | -29.62% |
| Atlanta GA | 182,158 | 113,677 | -68,481 | -23.15% |
| Baltimore MD | 80,687 | 51,547 | -29,140 | -22.04% |
| Denver CO | 65,206 | 42,087 | -23,119 | -21.55% |
| San Francisco-Oakland-San Jose CA | 70,283 | 45,994 | -24,289 | -20.89% |
| New York, NY | 437,309 | 287,257 | -150,052 | -20.71% |
| Washington DC (Hagerstown MD) | 105,157 | 71,545 | -33,612 | -19.02% |
| Los Angeles CA | 236,844 | 169,877 | -66,967 | -16.47% |
| Nashville TN | 73,596 | 53,733 | -19,863 | -15.60% |
| Dallas-Ft. Worth TX | 146,714 | 117,426 | -29,288 | -11.09% |
| Las Vegas NV | 30,178 | 25,047 | -5,131 | -9.29% |
| Orlando-Daytona Beach-Melbourne FL | 87,388 | 72,761 | -14,627 | -9.13% |
| Columbus OH | 50,503 | 42,376 | -8,127 | -8.75% |
| Omaha NE | 22,138 | 18,886 | -3,252 | -7.93% |
| Philadelphia PA | 179,439 | 157,739 | -21,700 | -6.44% |
| Detroit MI | 97,562 | 86,254 | -11,308 | -6.15% |
| Boston MA-Manchester NH | 96,472 | 85,526 | -10,946 | -6.01% |
| Seattle-Tacoma WA | 73,037 | 65,368 | -7,669 | -5.54% |
| Phoenix AZ | 76,006 | 68,392 | -7,614 | -5.27% |
| Miami-Ft. Lauderdale FL | 86,536 | 81,530 | -5,006 | -2.98% |
| Sacramento-Stockton-Modesto CA | 47,209 | 45,679 | -1,530 | -1.65% |
| Honolulu HI | 6,781 | 6,603 | -178 | -1.33% |
| Raleigh-Durham (Fayetteville) NC | 51,995 | 51,770 | -225 | -0.22% |
| Little Rock-Pine Bluff AR | 15,595 | 15,551 | -44 | -0.14% |
| New Orleans LA | 30,246 | 30,825 | 579 | 0.95% |
| Birmingham (Ann and Tusc) AL | 31,663 | 32,523 | 860 | 1.34% |
| Syracuse NY | 11,687 | 12,128 | 441 | 1.85% |
| Houston TX | 62,565 | 65,148 | 2,583 | 2.02% |
| Milwaukee WI | 40,098 | 42,268 | 2,170 | 2.63% |
| Jackson MS | 8,863 | 9,477 | 614 | 3.35% |
| Jacksonville FL | 27,870 | 29,863 | 1,993 | 3.45% |
| Wilkes Barre-Scranton PA | 7,426 | 8,012 | 586 | 3.80% |
| Kansas City MO | 32,269 | 35,304 | 3,035 | 4.49% |
| Minneapolis-St. Paul MN | 60,749 | 67,042 | 6,293 | 4.92% |
| San Antonio TX | 24,758 | 27,976 | 3,218 | 6.10% |
| Cleveland-Akron (Canton) OH | 72,320 | 82,297 | 9,977 | 6.45% |
| Indianapolis IN | 74,224 | 85,244 | 11,020 | 6.91% |
| Cincinnati OH | 47,573 | 55,494 | 7,921 | 7.69% |
| San Diego CA | 40,631 | 47,514 | 6,883 | 7.81% |
| Mobile AL-Pensacola (Ft. Walton Beach) FL | 25,227 | 29,651 | 4,424 | 8.06% |
| Portland OR | 29,981 | 35,590 | 5,609 | 8.55% |
| Hartford & New Haven CT | 47,724 | 56,666 | 8,942 | 8.57% |
| Tulsa OK | 10,895 | 13,036 | 2,141 | 8.95% |
| Tampa-St. Petersburg (Sarasota) FL | 70,944 | 86,330 | 15,386 | 9.78% |
| Louisville KY | 23,746 | 28,978 | 5,232 | 9.92% |
| West Palm Beach-Ft. Pierce FL | 14,072 | 17,560 | 3,488 | 11.03% |
| Salt Lake City UT | 33,396 | 42,366 | 8,970 | 11.84% |
Methodology
Information on migration patterns and preferences was pulled from anonymized user data collected by Rent.’s internet listings services. For each lead submitted by a user, a record is created establishing the location of the user based on their IP address and user-selected security settings. These records are combined with information, including geographical information, about the listing of interest creating an origin-destination pair.
Outbound migration consists of a renter-to-listing pair. Inbound migration consists of a listing-to-renter pair. Where geographic information for either the renter or the listing was missing, the record was removed from this study. Aggregations were made based on renter location for outbound migration and on listing location for inbound location. Differences were calculated based on these aggregations. Only states with at least 10,000 inbound leads and only metros with at least 5,000 inbound leads were considered in this analysis.
Regional designations are based on U.S. Census regional designations which divides the nation into four geographic regions: Northeast (Connecticut, Maine, Massachusetts, New Hampshire, New Jersey, New York, Pennsylvania, Rhode Island and Vermont); Midwest (Illinois, Indiana, Iowa, Kansas, Michigan, Minnesota, Missouri, Nebraska, North Dakota, Ohio, South Dakota and Wisconsin); South (Alabama, Arkansas, Delaware, Florida, Georgia, Kentucky, Louisiana, Maryland, Mississippi, North Carolina, Oklahoma, South Carolina, Tennessee, Texas, Virginia, District of Columbia and West Virginia) and West (Alaska, Arizona, California, Colorado, Idaho, Montana, Nevada, New Mexico, Hawaii, Utah, Washington and Wyoming)
Information included in this article is for illustrative purposes only. The data contained herein do not constitute financial advice or a pricing guarantee.
Disclaimer
Artificial Intelligence Disclosure & Legal Disclaimer
AI Content Policy.
To provide our readers with timely and comprehensive coverage, South Florida Reporter uses artificial intelligence (AI) to assist in producing certain articles and visual content.
Articles: AI may be used to assist in research, structural drafting, or data analysis. All AI-assisted text is reviewed and edited by our team to ensure accuracy and adherence to our editorial standards.
Images: Any imagery generated or significantly altered by AI is clearly marked with a disclaimer or watermark to distinguish it from traditional photography or editorial illustrations.
General Disclaimer
The information contained in South Florida Reporter is for general information purposes only.
South Florida Reporter assumes no responsibility for errors or omissions in the contents of the Service. In no event shall South Florida Reporter be liable for any special, direct, indirect, consequential, or incidental damages or any damages whatsoever, whether in an action of contract, negligence or other tort, arising out of or in connection with the use of the Service or the contents of the Service.
The Company reserves the right to make additions, deletions, or modifications to the contents of the Service at any time without prior notice. The Company does not warrant that the Service is free of viruses or other harmful components.
")
")

")
")
")

")
")
