

As spring kicks off, rent prices continue to trend up across both unit types. According to our March analysis of one-bedroom apartments, 95.6 percent of statewide markets have increased. That equates to a national aggregate that has surged 22.2 percent year-over-year.
One area that has seen some relief is the Midwest. Kansas City, MO, Indianapolis, IN and Cleveland, OH, all saw significant decreases in both one-bedroom and two-bedroom apartments. Let’s look at where rent prices stand today.
National average rent price trends
Nationwide rent prices have continued their steep climb. Despite industry-wide predictions that increases would be smaller in 2022, both bedroom types are still up by double digits as the first quarter comes to a close. One- and two-bedroom rents in March were up 22.2 and 22.8 percent, respectively.
Month-over-month, prices for one-bedrooms increased by slightly less than one percent, while two-bedrooms increased by more than $50 compared to last month, or 2.6 percent.

| Unit Type | Average Rent | MoM Change | YoY Change |
|---|---|---|---|
| 1-Bedroom | $1,697 | +0.8% | +22.2% |
| 2-Bedroom | $2,050 | +2.6% | +22.8% |
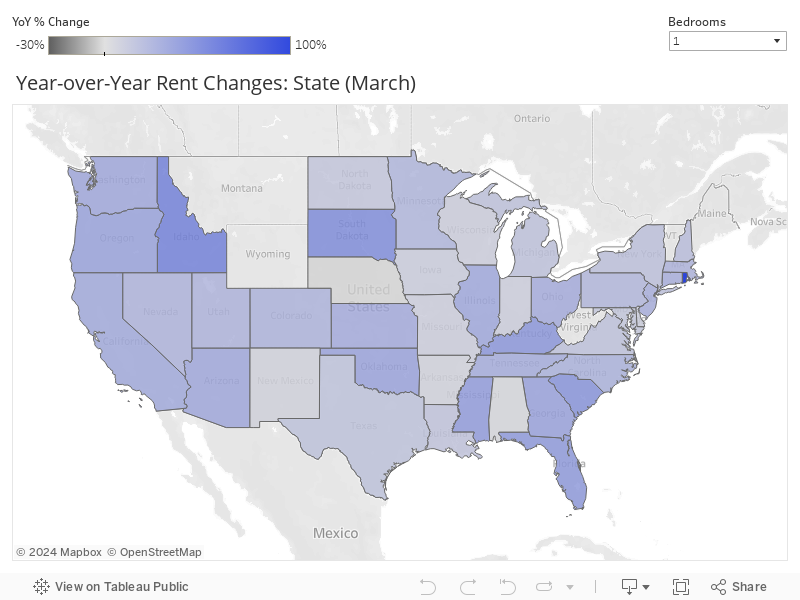
State average rent price trends
State to state, rent prices are up nearly across the board compared to this time last year. More than 95 percent of states have seen significant increases in rent prices for both apartment types. Only three states registered decreases. Nebraska and Alaska saw year-over-year decreases in one-bedroom rents, while the latter also saw decreases in two-bedroom rents along with Wyoming.
| Unit Type | Up | Down |
|---|---|---|
| 1-Bedroom | 95.6% | 4.4% |
| 2-Bedroom | 95.7% | 4.3% |

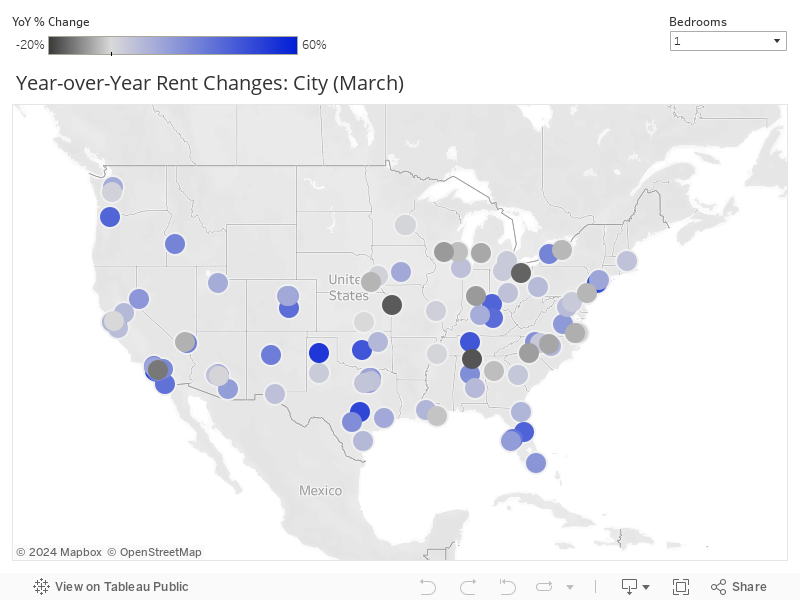
City average rent price trends
At the city level, rents are up in most and down in a few. Among the nation’s 100 largest cities, rents are up in more than 80 percent for both one- and two-bedrooms by an average of more than 19 percent.
One-bedroom city average rent price trends
The following cities have experienced the biggest increases in one-bedroom rent prices year-over-year. Four of these cities — Amarillo, TX; Jersey City, NJ; Fremont, CA and Orlando, FL — have populations of 300,000 or less.
- Long Beach, CA (+52.5 percent)
- Amarillo, TX (+51.8 percent)
- Austin, TX (+46.7 percent)
- Jersey City, NJ (+46.0 percent)
- Fremont, CA (+43.7 percent)
- Oklahoma City, OK (+42.2 percent)
- Nashville, TN (+42.0 percent)
- Orlando, FL (+38.2 percent)
- Cincinnati, OH (+37.8 percent)
- Portland, OR (+37.2 percent)
The following cities have experienced the biggest decreases in one-bedroom rent prices year-over-year. Five of these cities — Huntsville, AL; Durham, NC; Grand Rapids, MI; Norfolk, VA and Madison, WI— have populations of 300,000 or less.
- Huntsville, AL (-16.6 percent)
- Kansas City, MO (-15.8 percent)
- Cleveland, OH (-14.7 percent)
- Anaheim, CA (-12.0 percent)
- Indianapolis, IN (-7.7 percent)
- Madison, WI (-7.7 percent)
- Charlotte, NC (-7.2 percent)
- Durham, NC (-6.2 percent)
- Grand Rapids, MI (-6.0 percent)
- Norfolk, VA (-5.1 percent)

Two-bedroom city average rent price trends
The following cities have experienced the biggest increases in two-bedroom rent prices year-over-year. Five of these cities — Durham, NC; Little Rock, AR; Richmond, VA; Boise, ID and Fresno, CA — have populations of 300,000 or less.
- Durham, NC (+49.2 percent)
- Nashville, TN (+46.9 percent)
- Austin, TX (+43.4 percent)
- Tampa, FL (+41.9 percent)
- Miami, FL (+41.7 percent)
- Little Rock, AR (+39.2 percent)
- Richmond, VA (+37.8 percent)
- Boise, ID (+35.8 percent)
- Fresno, CA (+35.8 percent)
- Tucson, AZ (+35.6 percent)
The following cities have experienced the biggest decreases in two-bedroom rent prices year-over-year. Three of these cities — Columbus, GA; Lincoln, NE and Akron, OH — have populations of 300,000 or less.
- Columbus, GA (-20.5 percent)
- Wichita, KS (-19.7 percent)
- Kansas City, MO (-18.4 percent)
- New Orleans, LA (-17.2 percent)
- Memphis, TN (-9.1 percent)
- Lincoln, NE (-8.8 percent)
- Indianapolis, IN (-7.8 percent)
- Akron, OH (-7.3 percent)
- Cleveland, OH (-6.8 percent)
- Milwaukee, WI (-6.5 percent)
Overlap cities by average rent prices
Some cities reflect increases or decreases in rent prices across all bedroom types. We call these “overlap cities.”
Two cities in the top 10 has experienced year-over-year price increases in both one-bedroom and two-bedroom apartments:
Three cities in the top 10 have experienced year-over-year price decreases in both one-bedroom and two-bedroom apartments:
Rental industry trends
In addition to our pricing trends, here are a few key industry developments:
1. Affordability is still the No. 1 factor keeping renters from homeownership
A recent Redfin survey confirmed the number one factor keeping renters from buying homes is affordability. More than 30 percent of respondents said owning a home where they live isn’t possible. Another 30 percent said they couldn’t save for a down payment. Only 16 percent indicated rising mortgage rates were the main factor.
Of the financial obstacles hindering homeownership, 45 percent of respondents indicated debt was a reason, and 44 percent cited home prices that are too high in their area. Not having enough income to save for a home was the third most popular response with 38 percent of respondents citing savings as a significant obstacle. Only 19 percent indicated the high cost of rent as an obstacle, while 1 in 5 said they’re planning to move in the next three months to find cheaper rent.
2. Young adults and minorities have a harder time buying a home
According to a new survey from the Pew Research Center, 70 percent of Americans say young adults today have a more challenging time buying a home than their parent’s generation. Among the reasons are incomes that have failed to keep up with hosing costs, construction slowdowns limiting supply and a surge in demand brought by low mortgage rates during the pandemic
That last point has led to a near-record increase in the number of American homeowners. In 2020, the fourth quarter ended with 2.1 million more homeowners than in 2019, increasing the homeownership rate from 65.1 percent to 65.8 percent. But those increases have not been evenly distributed. Only households headed by White Americans saw a statistically significant increase in homeownership during that time. By the end of 2021, 74 percent of White Americans owned a home compared to 43 percent and 48 percent of Black and Hispanic Americans, respectively.
About this report
Our April 2022 Rent Report highlights year-over-year rent trends and price fluctuations that renters may experience in various parts of the United States. We compare rent prices for one-bedroom and two-bedroom apartments to determine which unit types and which of the country’s most populated cities are becoming more affordable or more expensive for renters. States and cities with insufficient inventory are excluded from this report.
| Rank by Population | City, State | Population | 1-BR Avg Rent, March 2022 | 1-BR YoY Change |
|---|---|---|---|---|
| 70 | Jersey City, NJ | 262,075 | $3,847 | 46.03% |
| 20 | Boston, MA | 692,600 | $3,718 | 7.10% |
| 15 | San Francisco, CA | 881,549 | $3,508 | 11.85% |
| 96 | Glendale, CA | 199,303 | $3,372 | 29.74% |
| 66 | Irvine, CA | 287,401 | $3,157 | 35.55% |
| 7 | San Diego, CA | 1,423,851 | $3,141 | 33.21% |
| 1 | Los Angeles, CA | 3,979,576 | $3,092 | 16.77% |
| 43 | Oakland, CA | 433,031 | $3,038 | 0.38% |
| 80 | Fremont, CA | 241,110 | $3,027 | 43.69% |
| 53 | Santa Ana, CA | 332,318 | $2,925 | 25.03% |
| 41 | Long Beach, CA | 462,628 | $2,918 | 52.47% |
| 40 | Miami, FL | 467,963 | $2,744 | 21.62% |
| 9 | San Jose, CA | 1,021,795 | $2,683 | 8.96% |
| 54 | Riverside, CA | 331,360 | $2,665 | 25.70% |
| 97 | Huntington Beach, CA | 199,223 | $2,658 | 33.97% |
| 94 | Yonkers, NY | 200,370 | $2,606 | 16.24% |
| 19 | Washington, DC | 705,749 | $2,457 | 9.10% |
| 2 | Chicago, IL | 2,693,976 | $2,375 | 7.74% |
| 17 | Seattle, WA | 753,675 | $2,363 | 14.92% |
| 74 | Scottsdale, AZ | 258,069 | $2,295 | 15.47% |
| 34 | Sacramento, CA | 513,624 | $2,254 | 10.19% |
| 22 | Nashville, TN | 670,820 | $2,245 | 42.03% |
| 25 | Portland, OR | 654,741 | $2,221 | 37.22% |
| 18 | Denver, CO | 727,211 | $2,137 | 15.14% |
| 5 | Philadelphia, PA | 1,584,064 | $2,096 | -4.23% |
| 65 | Orlando, FL | 287,442 | $2,061 | 38.18% |
| 10 | Austin, TX | 978,908 | $1,933 | 46.75% |
| 86 | Tacoma, WA | 217,827 | $1,931 | 2.38% |
| 77 | Gilbert, AZ | 254,114 | $1,929 | 24.65% |
| 69 | Saint Petersburg, FL | 265,351 | $1,890 | 19.56% |
| 64 | Plano, TX | 287,677 | $1,876 | 17.46% |
| 60 | Saint Louis, MO | 300,576 | $1,865 | 3.06% |
| 93 | Frisco, TX | 200,490 | $1,862 | 16.86% |
| 52 | Anaheim, CA | 350,365 | $1,830 | -12.00% |
| 76 | Buffalo, NY | 255,284 | $1,798 | 27.07% |
| 57 | Henderson, NV | 320,189 | $1,790 | 29.30% |
| 51 | Aurora, CO | 379,289 | $1,779 | 16.99% |
| 48 | New Orleans, LA | 390,144 | $1,734 | -2.46% |
| 75 | Reno, NV | 255,601 | $1,731 | 21.19% |
| 84 | Boise, ID | 228,959 | $1,719 | 27.15% |
| 29 | Baltimore, MD | 593,490 | $1,696 | 4.68% |
| 46 | Tampa, FL | 399,700 | $1,682 | 32.37% |
| 8 | Dallas, TX | 1,343,573 | $1,666 | 19.85% |
| 82 | Irving, TX | 239,798 | $1,653 | 23.33% |
| 35 | Atlanta, GA | 506,811 | $1,613 | -3.20% |
| 61 | Pittsburgh, PA | 300,286 | $1,600 | 9.37% |
| 23 | Detroit, MI | 670,031 | $1,588 | 4.58% |
| 98 | McKinney, TX | 199,177 | $1,557 | 24.01% |
| 83 | Richmond, VA | 230,436 | $1,515 | 20.49% |
| 26 | Las Vegas, NV | 651,319 | $1,512 | -4.84% |
| 88 | Birmingham, AL | 209,403 | $1,508 | 24.37% |
| 44 | Minneapolis, MN | 429,606 | $1,475 | 1.81% |
| 58 | Saint Paul, MN | 308,096 | $1,463 | 1.49% |
| 92 | Salt Lake City, UT | 200,567 | $1,462 | 14.37% |
| 39 | Raleigh, NC | 474,069 | $1,457 | 11.82% |
| 89 | Rochester, NY | 205,695 | $1,428 | -4.01% |
| 67 | Durham, NC | 278,993 | $1,419 | -6.25% |
| 13 | Columbus, OH | 898,553 | $1,407 | 7.47% |
| 11 | Jacksonville, FL | 911,507 | $1,401 | 11.21% |
| 42 | Virginia Beach, VA | 449,974 | $1,400 | -0.85% |
| 3 | Houston, TX | 2,320,268 | $1,397 | 15.20% |
| 33 | Mesa, AZ | 518,012 | $1,385 | 21.30% |
| 37 | Colorado Springs, CO | 478,221 | $1,375 | 34.36% |
| 4 | Phoenix, AZ | 1,680,992 | $1,370 | 7.62% |
| 59 | Cincinnati, OH | 303,940 | $1,355 | 37.80% |
| 71 | Chandler, AZ | 261,165 | $1,317 | 1.58% |
| 79 | Norfolk, VA | 242,742 | $1,311 | -5.09% |
| 28 | Louisville, KY | 617,638 | $1,290 | 13.94% |
| 30 | Milwaukee, WI | 590,157 | $1,289 | -3.06% |
| 78 | Winston-Salem, NC | 247,945 | $1,288 | 23.09% |
| 12 | Fort Worth, TX | 909,585 | $1,283 | 6.32% |
| 14 | Charlotte, NC | 885,708 | $1,231 | -7.19% |
| 36 | Kansas City, MO | 495,327 | $1,207 | -15.84% |
| 50 | Cleveland, OH | 381,009 | $1,205 | -14.66% |
| 31 | Albuquerque, NM | 560,513 | $1,201 | 29.33% |
| 56 | Lexington, KY | 323,152 | $1,193 | 34.76% |
| 6 | San Antonio, TX | 1,547,253 | $1,174 | 24.15% |
| 90 | Grand Rapids, MI | 201,013 | $1,174 | -5.97% |
| 87 | Des Moines, IA | 214,237 | $1,151 | 15.24% |
| 47 | Arlington, TX | 398,854 | $1,146 | 16.35% |
| 32 | Tucson, AZ | 548,073 | $1,137 | 19.18% |
| 81 | Garland, TX | 239,928 | $1,136 | 7.31% |
| 72 | Madison, WI | 259,680 | $1,126 | -7.67% |
| 100 | Augusta, GA | 197,888 | $1,115 | 5.77% |
| 16 | Indianapolis, IN | 876,384 | $1,110 | -7.69% |
| 85 | Baton Rouge, LA | 220,236 | $1,077 | 11.00% |
| 27 | Memphis, TN | 651,073 | $1,063 | 1.48% |
| 95 | Amarillo, TX | 199,371 | $1,025 | 51.78% |
| 24 | Oklahoma City, OK | 655,057 | $999 | 42.18% |
| 63 | Lincoln, NE | 289,102 | $989 | -4.30% |
| 55 | Corpus Christi, TX | 326,586 | $977 | 10.25% |
| 38 | Omaha, NE | 478,192 | $976 | 2.61% |
| 21 | El Paso, TX | 681,728 | $951 | 7.89% |
| 62 | Greensboro, NC | 296,710 | $858 | 5.38% |
| 68 | Toledo, OH | 272,779 | $828 | 4.67% |
| 91 | Huntsville, AL | 200,574 | $828 | -16.56% |
| 49 | Wichita, KS | 389,938 | $817 | 0.22% |
| 45 | Tulsa, OK | 401,190 | $757 | 10.30% |
| 73 | Lubbock, TX | 258,862 | $733 | 4.27% |
| 99 | Montgomery, AL | 198,525 | $652 | 9.63% |
Methodology
To determine average rent prices, we started with April 2022 data from Apartment Guide and Rent.com’s multifamily rental property inventory. From there, we evaluated changes seen since April 2021. Monthly prices are based on the average price for that respective month as a whole.
We used a weighted average formula that more accurately represents price availability for each individual unit type and reduces the influence of seasonality on rent prices in specific markets. From there, we looked at historical standard deviations of our weighted rent prices to remove outlier markets and minimize potential volatility caused by lower inventory. Rent price increases and decreases per time period are based on the percentage change of apartment rental prices from April 2021.
The U.S. Census divides the country into four geographic regions: Northeast (Connecticut, Maine, Massachusetts, New Hampshire, New Jersey, New York, Pennsylvania, Rhode Island and Vermont); Midwest (Illinois, Indiana, Iowa, Kansas, Michigan, Minnesota, Missouri, Nebraska, North Dakota, Ohio, South Dakota and Wisconsin); South (Alabama, Arkansas, Delaware, Florida, Georgia, Kentucky, Louisiana, Maryland, Mississippi, North Carolina, Oklahoma, South Carolina, Tennessee, Texas, Virginia, District of Columbia and West Virginia) and West (Alaska, Arizona, California, Colorado, Idaho, Montana, Nevada, New Mexico, Hawaii, Utah, Washington and Wyoming). The top 100 cities in our analysis were determined by 2019 U.S. Census Bureau population estimates.
The rent information included in this article is used for illustrative purposes only. The data contained herein do not constitute financial advice or a pricing guarantee for any apartment.
Source: News Release
Disclaimer
Artificial Intelligence Disclosure & Legal Disclaimer
AI Content Policy.
To provide our readers with timely and comprehensive coverage, South Florida Reporter uses artificial intelligence (AI) to assist in producing certain articles and visual content.
Articles: AI may be used to assist in research, structural drafting, or data analysis. All AI-assisted text is reviewed and edited by our team to ensure accuracy and adherence to our editorial standards.
Images: Any imagery generated or significantly altered by AI is clearly marked with a disclaimer or watermark to distinguish it from traditional photography or editorial illustrations.
General Disclaimer
The information contained in South Florida Reporter is for general information purposes only.
South Florida Reporter assumes no responsibility for errors or omissions in the contents of the Service. In no event shall South Florida Reporter be liable for any special, direct, indirect, consequential, or incidental damages or any damages whatsoever, whether in an action of contract, negligence or other tort, arising out of or in connection with the use of the Service or the contents of the Service.
The Company reserves the right to make additions, deletions, or modifications to the contents of the Service at any time without prior notice. The Company does not warrant that the Service is free of viruses or other harmful components.

")
")


