

By Jon Leckie NOTE: Pictures are interactive
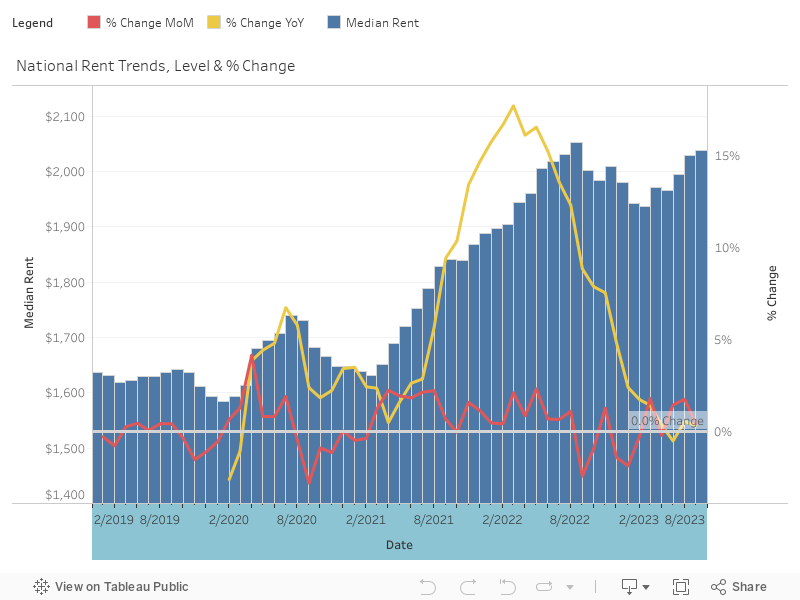
Rent prices continued to climb in July, growing 0.31 percent year over year. The increase is less than June’s 0.50 percent bump — and less than the 0.40 percent average yearly growth rate since February 2023 when prices began to climb after steady declines following last summer’s peak.
From June to July, rents rose by less than 0.50 percent. Specifically, the 0.41 percent increase was just the second monthly increase below 1 percent in the last five months. Including April’s -0.24 percent decrease, the only other sub-1-percent increase, monthly changes have averaged just over 1 percent since February’s low.
The national median rent price is now $2,038, only $15 less than levels from August 2022 when prices peaked at $2,053. Since February 2023, when rents bottomed out at $1,936, prices are up nearly 5 percent. Should rents continue to rise at the average rate since February, the national price would surpass last August’s record next month by nearly $5, setting another historical high.

Broad trends across the industry including an influx of new inventory and demand below seasonal norms have worked to slow rent growth to below-normal rates. Prices even dipped negative year over year in May. But rents continue to be elevated in the longer term. Over two years, the cost of renting has increased by 14 percent, representing annualized growth of nearly 7 percent and adding almost $250 to monthly rent bills. Over the course of the pandemic, rents have risen 25 percent, or more than $400, since 2019.
Let’s look at where rent prices stand today.
National rent price trends
National rents rose again in July. The 0.31 percent yearly increase in July was slightly lower than June’s 0.50 percent increase and comes after a slight decrease in May, the first yearly price drop since March 2020. Monthly growth slowed significantly compared to June. Rents rose 0.41 percent from June to July, compared to a nearly 2 percent increase from May to June.
Year-over-year, rents increased by double digits from October 2021 through August 2022, peaking at $2,053 and averaging yearly changes of 14.65 percent over that time. Price-level declines began in September 2022 and continued through February 2023, dropping 5.65 percent from August and reaching a low of $1,937.
Since February, rents have risen by more than 5 percent, adding more than $100 to monthly rent bills. By comparison, rents from February to June 2022 rose by 6.67 percent. In 2021 and 2020, prices rose by more than 9 percent. 2019 saw rents decline during this period, dropping by nearly 0.50 percent.
| Rental Market Summary | July 2023 | Year-over-Year | Month-over-Month |
|---|---|---|---|
| Median Monthly Price | $2,038 | 0.31% | 0.41% |
State rent price trends
State-level rents decreased on a yearly basis in 33.33 percent of markets in July, the same proportion as in June. Monthly increases ticked up with more than 64 percent of states seeing increases in July compared to 57 percent in June.
Regionally, the West was the only area to register yearly declines, dipping 1.12 percent year over year. In the Northeast, the most expensive region in the nation, rents grew by 4.65 percent on a yearly basis, followed by the Midwest, where rents rose by 4.31 percent. Despite the steep increase, the Midwest remained the most affordable with a median rent of just over $1,400. The South grew moderately at just one-quarter of 1 percent.
| Rental Market Summary | Markets Up | Markets Down |
|---|---|---|
| Year-over-Year (July ’22 vs ’23) | 66.67% | 33.33% |
| Month-over-Month | 64.29% | 35.71% |
Of the 10 largest yearly gainers, only New York state, which saw 13 percent rent growth year over year, was outside the South or Midwest. South Dakota and Mississippi lead yearly increases with growth above 20 percent. Iowa and North Dakota saw increases above 10 percent, while Wisconsin, Minnesota, Arkansas, Michigan and Indiana all experienced rent growth above 8 percent.
Despite these increases, the rent prices among these states excluding New York, averaged $1,266, or $772 less than the national median

Among the 10 states with the highest year-over-year rent growth, all demonstrated increases above 8 percent:
- South Dakota (+22.61 percent)
- Mississippi (+22.40 percent)
- Iowa (+14.25 percent)
- New York (+13.00 percent)
- North Dakota (+11.67 percent)
- Wisconsin (+9.55 percent)
- Minnesota (+8.75 percent)
- Arkansas (+8.62 percent)
- Michigan (+8.59 percent)
- Indiana (+8.21 percent)
Year-over-year state decreases
States driving declines in the West include Washington, which saw the largest drop at nearly 8 percent year over year. Oregon also saw declines of more than 5.50 percent, while Utah, Nevada and Idaho continued the trend of rental losses in the Mountain West after rapid and substantial gains during the pandemic. Arizona also saw declines albeit at a much lower rate of 0.39 percent year over year.
Pennsylvania saw the largest decline in the Northeast, dropping by nearly 6 percent. The remaining states among the 10 largest decliners were all from the South, including Texas, Florida, Maryland and Oklahoma.
In total, 14 states saw yearly declines with an average of nearly 3.50 percent.
Of the 10 states that saw the largest yearly decreases, five were in the West, four were in the South and one in the Northeast.
- Washington (-7.72 percent)
- Pennsylvania (-5.76 percent)
- Oregon (-5.66 percent)
- Utah (-4.99 percent)
- Nevada (-4.16 percent)
- Texas (-3.39 percent)
- Florida (-2.83 percent)
- Maryland (-2.67 percent)
- Oklahoma (-2.56 percent)
- Idaho (-2.48 percent)
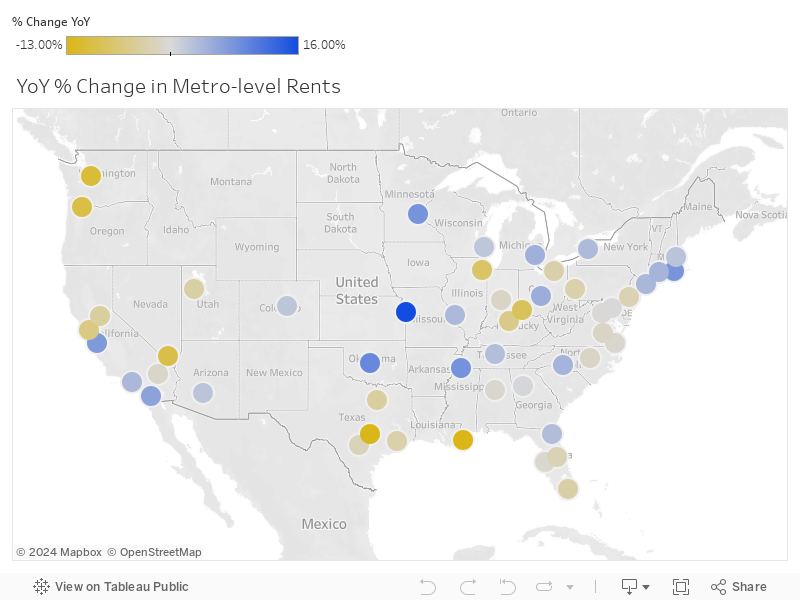
Metro area rent price trends
Among the 50 most populous metropolitan areas, the Midwest had the biggest share of the highest gainers in July.
The Kansas City, MO, metro saw the most significant yearly increase at 16.17 percent. Other Midwestern metros, including Columbus, Detroit and Minneapolis, saw increases of 5.08 percent, 4.74 percent and 8.14 percent, respectively. Oklahoma City, Memphis and Charlotte led yearly increases in the South.
Despite regional declines, California metros San Jose and San Diego were also among the largest yearly gainers with 7.38 percent and 6.42 percent increases. On the price reduction side, San Francisco and Sacramento, CA, saw yearly declines of nearly 6 and 4 percent, well behind regional neighbors Seattle, Portland and Las Vegas, which saw price drops of nearly 11 and 10 percent year over year.
The biggest rent declines were in the South with prices in New Orleans and Austin falling on either side of 13 percent year over year. Louisville, KY, another Southern metro, experienced yearly declines of 5.28 percent. In the Midwest, despite a regional increase above 4 percent, Cincinnati and Chicago saw yearly declines of 8.54 and 7.59 percent, respectively.
The following metro areas have experienced the greatest increase in rent prices year over year.
- Kansas City, MO (+16.17 percent)
- Oklahoma City, OK (+9.31 percent)
- Memphis, TN-MS-AR (+8.16 percent)
- Minneapolis-St. Paul-Bloomington, MN-WI (+8.14 percent)
- Providence-Warwick, RI-MA (+7.97 percent)
- San Jose-Sunnyvale-Santa Clara, CA (+7.38 percent)
- San Diego-Chula Vista-Carlsbad, CA (+6.42 percent)
- Columbus, OH (+5.08 percent)
- Detroit-Warren-Dearborn, MI (+4.74 percent)
- Charlotte-Concord-Gastonia, NC-SC (+4.30 percent)
The following metro areas have experienced the greatest decreases in rent prices year over year.
- New Orleans-Metairie, LA (-13.43 percent)
- Austin-Round Rock-Georgetown, TX (-12.81 percent)
- Seattle-Tacoma-Bellevue, WA (-10.75 percent)
- Portland-Vancouver-Hillsboro, OR-WA (-9.81 percent)
- Las Vegas-Henderson-Paradise, NV (-9.57 percent)
- Cincinnati, OH-KY-IN (-8.54 percent)
- Chicago-Naperville-Elgin, IL-IN-WI (-7.59 percent)
- San Francisco-Oakland-Berkeley, CA (-5.79 percent)
- Louisville/Jefferson County, KY-IN (-5.28 percent)
- Sacramento-Roseville-Folsom, CA (-3.93 percent)
Rental industry trends
In addition to our pricing trends, here are a few key industry developments.
1. Junk fees may be contributing to the housing affordability crisis
A recent National Consumer Law Center report revealed that additional rental ‘junk’ fees, such as pet fees, deposits, pest control fees and even arbitrary fees like a “January fee,” are worsening the affordable housing shortage.
The report found that rental housing fees put safe and decent housing even further out of reach for renters. These fees add to the high cost of rent — over 40 percent of renter households in the U.S. are cost-burdened and paying more than 30 percent of their income on housing costs.
The Biden Administration announced on July 19 its commitment to eliminate housing junk fees that are detrimental to consumers and to improve transparency in the process.
“Rental housing junk fees put safe and decent housing even more out of reach because renters must pay them on top of sky-high rents,” Ariel Nelson, staff attorney with the National Consumer Law Center, said in a press release. “We are greatly encouraged that the Biden Administration is taking rental housing junk fees seriously.”
2. First-time homebuyers need to earn 13 percent more than last year to buy a starter home
A first-time homebuyer must earn about $64,500 annually to afford a typical U.S. starter home, according to a recent report from Redfin. This is an increase of 13 percent ($7,200) from a year ago, as home prices continue to rise and mortgage rates remain elevated.
Cash buyers purchase almost 40 percent of these homes, and in the first quarter of 2023, a record 41 percent of investor purchases were for small homes with 1,400 or fewer square feet.
The demand for starter homes is high, but the supply is low, which has prompted competition and increased prices. “The most affordable homes for sale are no longer affordable to people with lower budgets due to the combination of rising prices and rising rates. That’s locking many Americans out of the housing market altogether,” Redfin Senior Economist Sheharyar Bokhari said in the report.
About this report
Our August 2023 Rent Report highlights year-over-year rent trends and price fluctuations that renters may experience in various parts of the United States. We compare rent prices across bedroom types to determine which of the country’s most populated metros are becoming more affordable or more expensive for renters. States and metros with insufficient inventory are excluded from this report.
| CBSA | Population | Median Rent | YoY % Change | MoM % Change |
|---|---|---|---|---|
| Kansas City, MO | 2,199,490 | $1,696 | 16.17% | 1.79% |
| Oklahoma City, OK | 1,441,647 | $1,310 | 9.31% | 0.31% |
| Memphis, TN | 1,336,103 | $1,700 | 8.16% | 0.77% |
| Minneapolis, MN | 3,690,512 | $1,897 | 8.14% | -1.24% |
| Providence, RI | 1,675,774 | $2,690 | 7.97% | 1.12% |
| San Jose, CA | 1,952,185 | $3,978 | 7.38% | -1.09% |
| San Diego, CA | 3,286,069 | $3,642 | 6.42% | 0.11% |
| Columbus, OH | 2,151,017 | $1,801 | 5.08% | 1.81% |
| Detroit, MI | 4,365,205 | $1,680 | 4.74% | 2.56% |
| Charlotte, NC | 2,701,046 | $1,965 | 4.30% | -1.05% |
| Hartford, CT | 1,211,906 | $2,154 | 4.26% | -2.70% |
| New York, NY | 19,768,458 | $4,431 | 4.00% | 1.53% |
| Los Angeles, CA | 12,997,353 | $3,654 | 3.81% | 0.34% |
| St. Louis, MO | 2,809,299 | $1,626 | 3.71% | 1.74% |
| Buffalo, NY | 1,162,336 | $1,617 | 3.61% | 0.92% |
| Jacksonville, FL | 1,637,666 | $1,699 | 3.25% | 3.96% |
| Nashville, TN | 2,012,476 | $2,298 | 3.11% | -0.80% |
| Boston, MA | 4,899,932 | $3,948 | 2.53% | -0.06% |
| Phoenix, AZ | 4,946,145 | $2,110 | 2.43% | -0.08% |
| Denver, CO | 2,972,566 | $2,792 | 2.30% | 1.47% |
| Milwaukee, WI | 1,566,487 | $1,735 | 2.21% | 2.27% |
| Atlanta, GA | 6,144,050 | $2,127 | 0.40% | -0.55% |
| Baltimore, MD | 2,838,327 | $2,048 | 0.13% | 1.52% |
| Washington, DC | 6,356,434 | $2,733 | -0.11% | -1.51% |
| Tampa, FL | 3,219,514 | $2,215 | -0.57% | -0.36% |
| Virginia Beach, VA | 1,803,328 | $1,728 | -0.62% | -0.85% |
| Birmingham, AL | 1,114,262 | $1,674 | -0.73% | 3.29% |
| Riverside, CA | 4,653,105 | $2,725 | -1.05% | -0.77% |
| Indianapolis, IN | 2,126,804 | $1,521 | -1.22% | 3.07% |
| Raleigh, NC | 1,448,411 | $2,054 | -1.31% | -2.04% |
| Richmond, VA | 1,324,062 | $1,787 | -1.33% | -1.57% |
| San Antonio, TX | 2,601,788 | $1,450 | -1.93% | 0.10% |
| Philadelphia, PA | 6,228,601 | $2,395 | -2.36% | -1.72% |
| Orlando, FL | 2,691,925 | $2,111 | -2.36% | -0.61% |
| Houston, TX | 7,206,841 | $1,703 | -2.92% | 1.75% |
| Pittsburgh, PA | 2,353,538 | $1,953 | -2.98% | -0.70% |
| Cleveland, OH | 2,075,662 | $1,489 | -3.01% | -2.14% |
| Miami, FL | 6,091,747 | $2,969 | -3.31% | -1.34% |
| Salt Lake City, UT | 1,263,061 | $1,890 | -3.51% | -0.25% |
| Dallas, TX | 7,759,615 | $2,160 | -3.74% | -2.63% |
| Sacramento, CA | 2,411,428 | $2,632 | -3.93% | -1.29% |
| Louisville/Jefferson County, KY | 1,284,566 | $1,376 | -5.29% | 0.79% |
| San Francisco, CA | 4,623,264 | $3,773 | -5.79% | -0.39% |
| Chicago, IL | 9,509,934 | $2,382 | -7.60% | -1.21% |
| Cincinnati, OH | 2,259,935 | $1,604 | -8.54% | 4.21% |
| Las Vegas, NV | 2,292,476 | $1,648 | -9.57% | 0.21% |
| Portland, OR | 2,511,612 | $2,335 | -9.81% | -1.99% |
| Seattle, WA | 4,011,553 | $2,833 | -10.75% | -2.09% |
| Austin, TX | 2,352,426 | $2,176 | -12.81% | 1.20% |
| New Orleans, LA | 1,261,726 | $1,722 | -13.43% | -2.66% |
Methodology
We analyzed rental property prices in July 2023, the last full month of data, from Rent.’s available inventory to identify our median rent prices at the national, state and metro levels. Our analysis combines inventory and bedroom types into one simple median that covers all available rental units at the time.
The top 50 metropolitan areas in our analysis are determined by U.S. Census Bureau population estimates for 2021.
More detailed information about our methodology can be found here.
The rent information included in this article is used for illustrative purposes only. The data contained herein do not constitute financial advice or a pricing guarantee for any apartment. The information contained in this article is for educational purposes only and does not, and is not intended to, constitute legal or financial advice. Readers are encouraged to seek professional legal or financial advice as they may deem it necessary.
Source: Rent.Research
Disclaimer
Artificial Intelligence Disclosure & Legal Disclaimer
AI Content Policy.
To provide our readers with timely and comprehensive coverage, South Florida Reporter uses artificial intelligence (AI) to assist in producing certain articles and visual content.
Articles: AI may be used to assist in research, structural drafting, or data analysis. All AI-assisted text is reviewed and edited by our team to ensure accuracy and adherence to our editorial standards.
Images: Any imagery generated or significantly altered by AI is clearly marked with a disclaimer or watermark to distinguish it from traditional photography or editorial illustrations.
General Disclaimer
The information contained in South Florida Reporter is for general information purposes only.
South Florida Reporter assumes no responsibility for errors or omissions in the contents of the Service. In no event shall South Florida Reporter be liable for any special, direct, indirect, consequential, or incidental damages or any damages whatsoever, whether in an action of contract, negligence or other tort, arising out of or in connection with the use of the Service or the contents of the Service.
The Company reserves the right to make additions, deletions, or modifications to the contents of the Service at any time without prior notice. The Company does not warrant that the Service is free of viruses or other harmful components.
")
")

")
")
")

")
")
